Chapter 95 — Secure AI Platform Security Metrics, Risk Quantification, Security KPIs/KRIs & Executive Security Decision-Making
95.1 Introduction
Security programs generate enormous amounts of technical data:
However, having security data is not the same as having security visibility.
A secure AI platform needs a measurement system that converts raw technical events into information that engineers, security teams, product owners, and executives can use to make decisions.
The objective is not to create the largest possible dashboard.
The objective is to answer questions such as:
What security risks currently exist?
Which risks are increasing?
Which controls are working?
Which controls are failing?
How quickly are vulnerabilities being remediated?
How effectively are incidents detected and contained?
Are AI-specific attacks increasing?
Are sensitive data-access controls functioning correctly?
Which security investments should happen next?
What level of residual risk is acceptable?
A mature security measurement program therefore connects:
Telemetry → Metrics → Indicators → Risk → Decisions → Actions → Verification
95.2 Security Measurement Objectives
A platform should define security measurement around several objectives.
Objective 1 — Visibility
Understand what is happening across the platform.
Objective 2 — Detection
Determine whether malicious or abnormal activity is being identified.
Objective 3 — Protection
Measure whether preventive controls are blocking unwanted behavior.
Objective 4 — Response
Measure how quickly and effectively security incidents are handled.
Objective 5 — Resilience
Measure the ability to continue operating and recover after security failures.
Objective 6 — Risk Reduction
Determine whether security investments actually reduce meaningful risk.
Objective 7 — Governance
Provide evidence that security policies and controls are operating as intended.
95.3 Metrics, KPIs and KRIs
These concepts should not be treated as interchangeable.
Metric
A metric is a measured value.
Examples:
number of vulnerabilities,
number of authentication failures,
number of incidents,
API request volume.
A metric does not necessarily indicate whether the organization is performing well or poorly.
KPI — Key Performance Indicator
A KPI measures progress toward an important operational or business objective.
Examples:
percentage of critical vulnerabilities remediated within SLA,
percentage of production deployments passing security gates,
percentage of security incidents handled within target time.
KRI — Key Risk Indicator
A KRI provides evidence that risk may be increasing or decreasing.
Examples:
number of critical exploitable vulnerabilities,
percentage of privileged accounts without strong authentication,
number of cross-tenant access violations,
percentage of AI requests bypassing expected policy controls,
number of unresolved high-severity security findings.
A useful relationship is:
Metric → KPI/KRI → Risk interpretation → Decision
95.4 Security Metrics Architecture
A secure AI platform should establish a layered measurement architecture.
Layer 1 — Raw Events
Examples:
Layer 2 — Normalized Security Events
Different systems should produce a consistent event model.
For example:
timestamp
tenant_id
actor_id
action
resource
result
risk_level
source
correlation_id
Layer 3 — Aggregated Metrics
Examples:
Layer 4 — Indicators
Metrics are transformed into KPIs and KRIs.
Layer 5 — Risk Models
Indicators contribute to risk assessments.
Layer 6 — Executive Reporting
Important risk information is presented in a concise decision-oriented format.
95.5 The Security Measurement Hierarchy
A useful hierarchy is:
Raw Telemetry
      ↓
Security Events
      ↓
Operational Metrics
      ↓
Security KPIs / KRIs
      ↓
Risk Indicators
      ↓
Business Impact
      ↓
Executive Decision
This prevents the common mistake of presenting thousands of technical numbers without explaining what they mean.
95.6 Core Security KPI Categories
A mature AI platform should consider several KPI categories.
95.6.1 Identity Security
Possible KPIs:
MFA coverage,
privileged-account coverage,
authentication success rate,
authentication anomaly rate,
dormant-account remediation rate,
access-review completion rate.
95.6.2 Vulnerability Management
Possible KPIs:
mean time to remediate,
critical vulnerability remediation percentage,
vulnerability SLA compliance,
percentage of production assets scanned,
percentage of dependencies with known critical vulnerabilities.
95.6.3 Application Security
Possible KPIs:
security defects discovered before production,
security defects discovered after production,
secure-code-review coverage,
security test pass rate,
dependency scanning coverage,
secret-scanning coverage.
95.6.4 AI Security
AI-specific KPIs may include:
prompt-injection detection rate,
jailbreak detection rate,
unsafe-output blocking rate,
tool-authorization denial rate,
model abuse rate,
AI policy violation rate,
unsafe tool-call prevention rate,
model-security evaluation coverage.
95.6.5 Data Security
Possible KPIs:
sensitive-data access violations,
unauthorized data-access attempts,
encryption coverage,
data-retention compliance,
deletion-request completion rate,
cross-tenant access violations.
95.6.6 Infrastructure Security
Possible KPIs:
95.6.7 Incident Response
Possible KPIs:
mean time to detect,
mean time to acknowledge,
mean time to contain,
mean time to recover,
incident recurrence rate,
incident postmortem completion rate.
95.7 Security KRIs
KPIs answer:
Are we performing effectively?
KRIs answer:
Is our risk increasing?
Examples include:
| KRI | Interpretation |
|---|
| Critical vulnerabilities | Exposure |
| Unpatched internet-facing systems | External attack risk |
| Privileged accounts | Privilege concentration |
| Cross-tenant violations | Isolation risk |
| High-risk AI requests | AI abuse risk |
| Unresolved security incidents | Operational risk |
| Expired secrets | Credential risk |
| Excessive permissions | Authorization risk |
| Failed backups | Recovery risk |
| Configuration drift | Control degradation |
A KRI should have an associated threshold or interpretation.
For example:
Green   = acceptable
Yellow  = increased attention
Orange  = management action required
Red     = immediate escalation
The exact thresholds should be determined by the platform's threat model and risk tolerance rather than copied blindly from another organization.
95.8 Security Risk Quantification
Risk should not simply be described as:
High
A more useful model considers multiple dimensions.
A simplified conceptual model is:
Risk = Likelihood × Impact
Where likelihood can incorporate:
exploitability,
exposure,
attacker interest,
control effectiveness,
asset accessibility.
Impact can incorporate:
confidentiality impact,
integrity impact,
availability impact,
financial impact,
legal impact,
operational impact,
customer impact,
reputational impact.
The resulting model should support prioritization rather than pretend to predict the future with mathematical certainty.
95.9 Risk Scoring
A practical scoring model might use normalized dimensions:
Risk Score =
Exposure × Exploitability × Impact × Control Weakness
For example, a vulnerability affecting:
an internal development environment,
with strong network isolation,
no sensitive data,
and rapid patch capability
may represent substantially less business risk than the same vulnerability affecting:
an internet-facing production service,
containing sensitive customer data,
with privileged access,
and no compensating control.
Therefore, severity alone is insufficient.
95.10 Risk-Based Prioritization
Security teams should prioritize findings using contextual information.
A useful priority sequence is:
actively exploited issues,
exposed critical systems,
vulnerabilities affecting sensitive data,
identity and privilege weaknesses,
cross-tenant isolation weaknesses,
critical infrastructure vulnerabilities,
high-impact AI control failures,
lower-risk technical debt.
This helps avoid spending all available security resources on low-impact findings simply because they are numerous.
95.11 Security Debt
Security debt is accumulated exposure caused by postponed security improvements.
Examples include:
Security debt should be measured.
Useful measurements include:
number of overdue findings,
age of unresolved findings,
unsupported components,
percentage of legacy services,
number of exceptions,
number of expired risk acceptances.
95.12 Exception Management Metrics
Security exceptions are sometimes necessary.
Examples:
temporary use of an older dependency,
delayed migration,
temporary elevated permission,
temporary security-control bypass.
However, exceptions create risk.
Track:
An exception without an expiration date can effectively become permanent.
95.13 Vulnerability Metrics
A mature vulnerability-management program should measure more than vulnerability count.
Important measurements include:
Vulnerability density
Number of vulnerabilities relative to the number of assets or services.
Aging
How long vulnerabilities remain unresolved.
SLA compliance
Percentage remediated within required time.
Exploitability
Whether practical exploitation is known or plausible.
Exposure
Whether the affected system is externally reachable.
Asset criticality
Importance of the affected service.
Recurrence
Whether the same vulnerability class repeatedly appears.
The last metric is particularly valuable because recurring vulnerabilities may indicate a systemic engineering problem.
95.14 Mean Time to Detect
MTTD measures the time between the beginning of a security event and detection.
Conceptually:
MTTD = Detection Time − Event Start Time
A lower MTTD generally indicates stronger detection capability.
However, organizations should distinguish:
Otherwise, metrics can become misleading.
95.15 Mean Time to Respond
MTTR can refer to different things depending on organizational terminology.
Therefore, security teams should define precisely whether MTTR means:
A mature dashboard should avoid ambiguous terminology.
95.16 Mean Time to Contain
Containment measures how quickly harmful activity is prevented from continuing.
Examples:
disabling a compromised account,
isolating a workload,
blocking a malicious token,
quarantining an uploaded file,
disabling a compromised integration.
Containment should be measured separately from full recovery.
95.17 Detection Quality
High alert volume does not necessarily mean strong security.
A security system can generate thousands of alerts and still miss important attacks.
Important metrics include:
true-positive rate,
false-positive rate,
alert precision,
detection coverage,
detection latency,
missed detection rate,
analyst escalation rate.
The objective is useful detection, not maximum alert generation.
95.18 AI Security Metrics
AI platforms require additional measurements.
Possible metrics include:
Prompt Injection
attempted injection events,
successful policy bypasses,
blocked injections,
high-risk injection patterns.
Jailbreak Resistance
Tool Security
unauthorized tool-call attempts,
blocked tool calls,
high-risk tool approvals,
tool execution failures.
Output Safety
Model Abuse
automated abuse attempts,
unusual generation patterns,
excessive requests,
suspicious account behavior.
These measurements should be combined with qualitative evaluation because automated security metrics can miss important failure modes.
95.19 AI Security Regression Metrics
Whenever a model, prompt, policy, retrieval system, or orchestration layer changes, security should be reevaluated.
A useful model is:
New Version
     ↓
Security Test Suite
     ↓
Baseline Comparison
     ↓
Regression Detection
     ↓
Approval / Rejection
Track:
This makes AI security measurable across versions.
95.20 Security Control Effectiveness
A control should not be considered effective merely because it exists.
For each important control, measure:
implementation,
coverage,
correct operation,
detection of failures,
response to failure.
For example, MFA may technically be enabled while some privileged accounts remain exempt.
Therefore:
MFA configured ≠ MFA coverage = 100%
Measurement must reflect actual enforcement.
95.21 Control Coverage
A useful security metric is:
Control Coverage = Protected Assets / Applicable Assets
Examples:
percentage of services covered by runtime monitoring,
percentage of repositories covered by secret scanning,
percentage of production workloads covered by vulnerability scanning,
percentage of privileged users covered by phishing-resistant authentication.
Coverage should be segmented by risk.
Protecting 99% of low-risk systems while leaving the most critical system unprotected is not equivalent to achieving effective coverage.
95.22 Security Control Failure Rate
Organizations should also measure how often controls fail.
Examples:
failed backup jobs,
broken security scanners,
disabled monitoring agents,
failed policy evaluations,
expired certificates,
failed malware scans.
Control failure itself is a security signal.
95.23 Executive Security Dashboard
Executives generally do not need thousands of technical events.
An executive dashboard should focus on:
Risk
top security risks,
risk trend,
residual risk,
accepted risk.
Security posture
Incidents
active incidents,
major incidents,
incident trend,
recovery status.
AI security
major AI-security findings,
model-security regression status,
policy-bypass trends.
Resilience
Decisions required
funding,
risk acceptance,
architectural changes,
remediation deadlines.
95.24 Security Trend Analysis
A single measurement is often less useful than a trend.
For example:
January      42 critical findings
February     37
March        29
April        18
The trend suggests improvement.
However, the organization should also ask:
Did asset inventory decrease?
Did scanning coverage decrease?
Were findings closed or merely reclassified?
Did the environment change?
Did detection quality change?
Security metrics require context.
95.25 Leading and Lagging Indicators
Leading indicators
These provide early warning.
Examples:
Lagging indicators
These describe outcomes.
Examples:
A mature program uses both.
95.26 Security Objectives and Measurement
Every major security objective should have measurable evidence.
Example:
Objective
Protect customer data.
Controls
encryption,
access control,
tenant isolation,
monitoring,
retention policies.
Metrics
unauthorized access attempts,
encryption coverage,
cross-tenant violation count,
sensitive-data access review completion.
Outcome
Reduced probability and impact of unauthorized data exposure.
This creates traceability between engineering controls and business objectives.
95.27 Metrics Anti-Patterns
Security measurement can fail in predictable ways.
Anti-pattern 1 — Vanity metrics
Example:
We generated 10 million security logs.
Large numbers do not automatically represent good security.
Anti-pattern 2 — Counting without context
Example:
5,000 vulnerabilities exist.
This does not tell management which vulnerabilities matter most.
Anti-pattern 3 — Optimizing the metric
If teams are rewarded solely for reducing vulnerability counts, they may close or reclassify findings without reducing real risk.
Anti-pattern 4 — Ignoring coverage
A perfect security score from 20% asset coverage is meaningless.
Anti-pattern 5 — Ignoring uncertainty
Security metrics often contain incomplete information.
Dashboards should indicate measurement confidence where appropriate.
95.28 Metric Manipulation Resistance
Important security metrics should be designed so that they cannot easily be improved without improving actual security.
For example, instead of:
Number of vulnerabilities
use:
Number of unresolved exploitable vulnerabilities affecting critical production assets.
Instead of:
Number of security tests executed
use:
Percentage of critical security controls passing required tests.
This makes metrics harder to game.
95.29 Security Scorecards
A platform can maintain a security scorecard containing:
Identity Security
Application Security
Infrastructure Security
AI Security
Data Security
Supply Chain Security
Incident Response
Resilience
Governance
Each category can contain:
current score,
previous score,
target,
trend,
major weaknesses,
accountable owner.
The score should remain explainable.
An unexplained “security score = 83” is less useful than a transparent control-based assessment.
95.30 Risk Appetite
Organizations need explicit boundaries around acceptable risk.
Examples:
no unresolved critical vulnerabilities on internet-facing production systems,
no unapproved cross-tenant data access,
no production secrets committed to source control,
no privileged account without strong authentication,
no deployment with failed critical security gates.
These requirements become measurable risk boundaries.
95.31 Risk Tolerance
Risk appetite is broad.
Risk tolerance defines acceptable variation.
For example:
Critical vulnerability:
Target = 0
Tolerance = 0

High vulnerability:
Target = < 10
Tolerance = < 20

Temporary security exception:
Target = < 5
Maximum age = 30 days
Actual thresholds should be determined by the organization's risk model.
95.32 Risk Acceptance
Not every risk can be eliminated.
When risk is accepted, record:
risk description,
affected asset,
potential impact,
likelihood,
compensating controls,
owner,
approval authority,
expiration date,
review schedule.
Risk acceptance should be an explicit decision rather than an undocumented assumption.
95.33 Security Investment Decisions
Metrics should help answer:
Where should security resources be invested?
Possible investment areas include:
identity modernization,
infrastructure hardening,
AI safety testing,
security engineering,
monitoring,
incident response,
backup and recovery,
dependency modernization,
security automation.
A useful prioritization principle is:
Invest where risk reduction per unit of effort is greatest.
95.34 Security Return on Investment
Traditional ROI calculations can be difficult because security prevents events that may never occur.
Therefore, security investment analysis should consider:
exposure reduction,
control coverage,
incident probability,
potential impact,
regulatory requirements,
operational resilience,
customer trust,
engineering efficiency.
Security should not be evaluated only through direct financial savings.
95.35 Board-Level Security Reporting
Board-level reporting should answer:
What are our most important security risks?
Are those risks increasing or decreasing?
What incidents occurred?
What has changed since the previous period?
Are critical controls working?
What remains unresolved?
What decisions or resources are required?
Technical detail can be provided as supporting material rather than overwhelming the primary report.
95.36 Security Accountability
Every major security metric should have an owner.
A useful model is:
| Measurement | Owner |
|---|
| Identity security | IAM team |
| Vulnerability remediation | Platform/security engineering |
| AI security | AI security team |
| Data protection | Data/security team |
| Incident response | SOC/IR |
| Resilience | Infrastructure team |
| Compliance evidence | Governance/security |
| Executive risk | Security leadership |
Ownership prevents dashboards from becoming passive reporting systems.
95.37 Security Measurement Lifecycle
A mature measurement lifecycle is:
Define Objective
      ↓
Identify Risk
      ↓
Identify Controls
      ↓
Define Metrics
      ↓
Collect Telemetry
      ↓
Validate Data
      ↓
Calculate KPIs/KRIs
      ↓
Analyze Trends
      ↓
Review Risk
      ↓
Make Decision
      ↓
Implement Improvement
      ↓
Measure Again
This turns security measurement into a continuous improvement process.
95.38 Data Quality for Security Metrics
Bad telemetry creates bad decisions.
Security measurement systems should validate:
timestamps,
event identity,
tenant identifiers,
severity values,
event completeness,
duplicate events,
missing fields,
clock synchronization,
source reliability.
A metric should indicate when its underlying data is incomplete.
95.39 Metric Retention
Security measurements should be retained according to their purpose and applicable data-governance requirements.
Short-term metrics may support:
Long-term metrics may support:
trend analysis,
audits,
governance,
strategic planning.
Retention should avoid unnecessarily preserving sensitive raw security data.
95.40 Privacy-Preserving Security Metrics
Security analytics can accidentally expose personal information.
Examples include:
user identifiers,
IP addresses,
message contents,
uploaded filenames,
customer metadata.
Where possible, reporting systems should use:
aggregation,
pseudonymous identifiers,
role-based access,
minimum necessary detail,
restricted raw-event access.
Executives generally need risk information, not individual user data.
95.41 Tenant-Aware Metrics
For multi-tenant AI systems, security metrics should support tenant-level analysis.
Examples:
suspicious activity by tenant,
API abuse by tenant,
storage anomalies,
cross-tenant access attempts,
tenant-specific policy violations.
However, one tenant should not gain visibility into another tenant's sensitive security telemetry.
Administrative dashboards therefore require strict authorization.
95.42 Security Metrics for AI Media Platforms
For an AI media platform, useful measurements include:
Upload security
AI generation
Image/video processing
User security
suspicious login activity,
account takeover indicators,
API abuse.
Storage
unauthorized object access,
unexpected download spikes,
sharing-policy violations.
95.43 Security Metrics for AI Agents
Agentic systems require additional measurements.
Track:
tool invocation volume,
denied tool calls,
privileged tool usage,
human approvals,
rejected plans,
policy violations,
agent execution failures,
unexpected tool sequences,
high-risk action attempts.
A particularly important metric is:
High-risk action approval rate
A sudden increase may indicate:
changing user behavior,
model behavior drift,
policy weakness,
compromised accounts,
adversarial activity.
95.44 Security Drift
Security posture can deteriorate even when no major incident occurs.
Examples:
new services bypass standard controls,
monitoring coverage decreases,
permissions expand,
old dependencies return,
policy exceptions accumulate.
Therefore, track security drift over time.
Useful indicators include:
configuration drift,
control coverage drift,
privilege drift,
dependency drift,
model-security drift.
95.45 Model Drift and Security Drift
AI model behavior may change after:
model upgrades,
prompt changes,
retrieval changes,
safety-policy changes,
fine-tuning,
provider changes.
Security evaluation should therefore be repeated after meaningful changes.
A security regression can occur even when model quality improves.
95.46 Automated Security Reporting
Reporting can be automated when the underlying metrics are trustworthy.
A pipeline might be:
Telemetry
   ↓
Normalization
   ↓
Metric Calculation
   ↓
Threshold Evaluation
   ↓
Risk Classification
   ↓
Dashboard
   ↓
Alert / Escalation
Automation should not eliminate human judgment for high-impact risk decisions.
95.47 Threshold-Based Alerts
Examples:
Critical vulnerability count > 0
        → Security escalation

Cross-tenant violation detected
        → Immediate investigation

Privileged authentication failure spike
        → SOC alert

Backup failure rate exceeds threshold
        → Reliability escalation

AI policy bypass regression detected
        → Deployment gate
Thresholds should be risk-based and periodically reviewed.
95.48 Anomaly Detection
Static thresholds cannot detect every security problem.
Behavioral analytics can identify:
unusual API activity,
unusual data downloads,
unusual tool use,
unusual authentication patterns,
unusual model consumption,
unexpected administrative activity.
However, anomaly detection itself can generate false positives.
It should therefore be combined with contextual signals.
95.49 Correlation of Security Signals
One event may not be significant alone.
Consider:
Failed login
     +
Successful login
     +
New device
     +
Large data download
     +
Privileged API call
Together, these signals may represent a high-risk sequence.
Security analytics should correlate events using:
user,
tenant,
device,
IP/network context,
session,
resource,
time,
correlation identifiers.
95.50 Security Risk Heat Maps
Risk heat maps can help communicate:
likelihood,
impact,
business criticality.
However, they should complement detailed risk records rather than replace them.
A heat map is a communication tool, not a complete risk-management system.
95.51 Continuous Security Validation
Metrics should be validated through testing.
Examples:
This verifies that reported security posture corresponds to real-world behavior.
95.52 Security Metrics and Continuous Improvement
A useful improvement loop is:
Measure
  ↓
Identify Weakness
  ↓
Prioritize
  ↓
Remediate
  ↓
Validate
  ↓
Measure Again
If remediation does not improve the relevant metric or risk indicator, investigate why.
95.53 Minimum Security Dashboard
A small AI platform can begin with a limited dashboard.
Recommended initial indicators:
critical vulnerabilities,
high vulnerabilities,
unresolved security incidents,
MTTD,
time to containment,
MFA coverage,
privileged-account coverage,
security-control coverage,
backup success rate,
AI safety regression status,
cross-tenant violation count,
active security exceptions.
This is usually more useful than creating hundreds of metrics immediately.
95.54 Mature Security Dashboard
A larger organization can expand into:
identity,
application,
infrastructure,
cloud,
AI,
data,
supply chain,
incident response,
resilience,
compliance,
privacy,
third-party risk.
Each category should maintain a small number of meaningful indicators.
95.55 Security Metrics Governance
Metrics themselves require governance.
Define:
metric owner,
definition,
calculation method,
data sources,
refresh frequency,
target,
threshold,
exceptions,
review schedule.
A metric without a documented definition can change meaning over time.
95.56 Recommended Metric Definition Template
Each metric should document:
Metric Name:
Purpose:
Category:
Owner:
Data Sources:
Calculation:
Frequency:
Target:
Warning Threshold:
Critical Threshold:
Scope:
Known Limitations:
Retention:
Review Frequency:
This improves consistency and auditability.
95.57 Executive Decision Framework
Security reporting should eventually lead to a decision.
A useful structure is:
Situation
What is happening?
Risk
Why does it matter?
Evidence
What data supports the conclusion?
Options
What actions are available?
Recommendation
Which action is preferred?
Cost
What resources are required?
Residual Risk
What risk remains after the action?
This turns security reporting into decision support.
95.58 Security Metrics Maturity Model
Level 1 — Reactive
Level 2 — Managed
defined KPIs,
vulnerability tracking,
incident metrics.
Level 3 — Risk-Based
KRIs,
contextual risk scoring,
control effectiveness.
Level 4 — Continuous
Level 5 — Adaptive
predictive indicators,
AI-assisted detection,
continuous risk optimization,
automated evidence generation,
integrated executive decision support.
Organizations should progress gradually rather than attempting Level 5 immediately.
95.59 Practical Implementation Roadmap
Phase 1 — Establish Visibility
Implement:
Phase 2 — Establish KPIs
Create:
vulnerability KPIs,
identity KPIs,
incident KPIs,
resilience KPIs.
Phase 3 — Establish KRIs
Add:
critical exposure,
privilege risk,
data-access risk,
AI-security risk,
configuration drift.
Phase 4 — Establish Risk Quantification
Connect:
assets,
threats,
vulnerabilities,
controls,
business impact.
Phase 5 — Establish Continuous Validation
Automate:
control testing,
AI security regression testing,
configuration validation,
recovery testing.
Phase 6 — Establish Executive Decision Support
Provide:
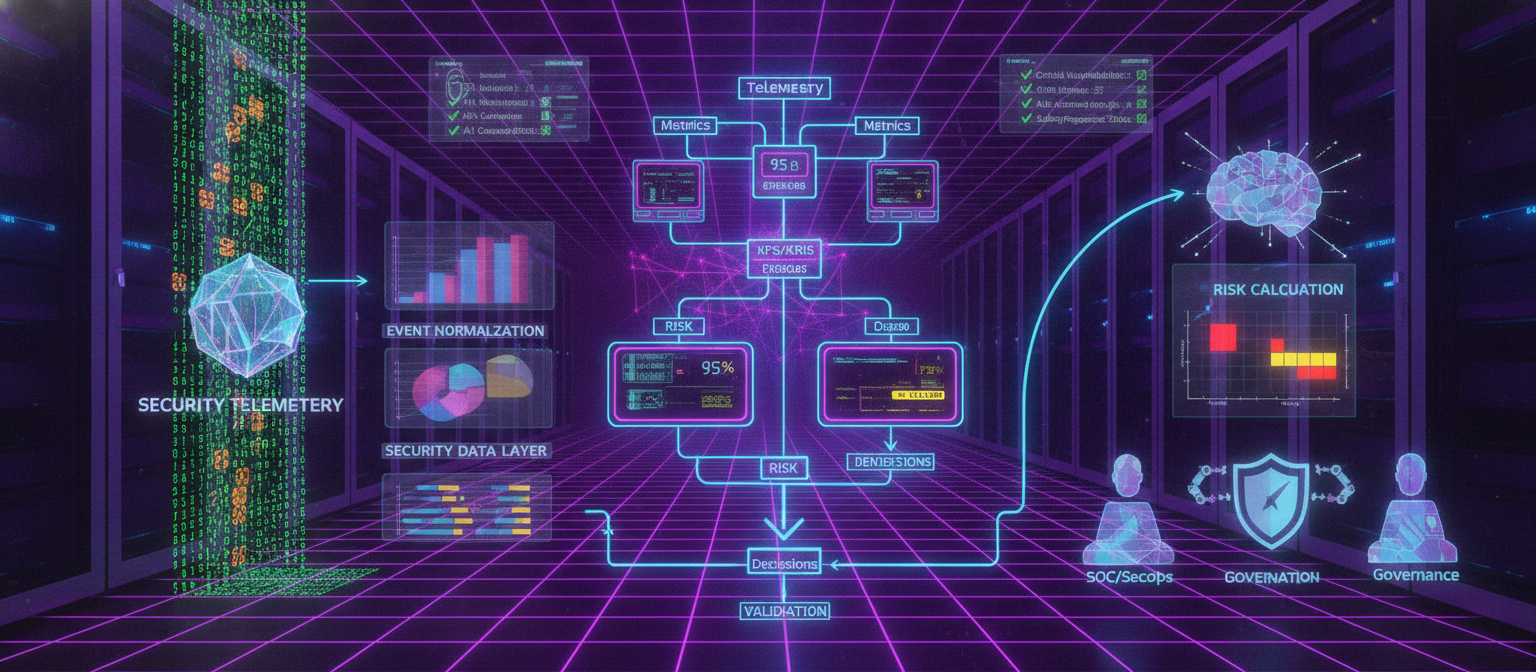
95.60 Final Security Architecture
A mature security measurement architecture can be represented as:
                    SECURITY TELEMETRY
                           │
        ┌──────────────────┼──────────────────┐
        │                  │                  │
     Identity          Infrastructure       AI
        │                  │                  │
        └──────────────────┼──────────────────┘
                           ↓
                  EVENT NORMALIZATION
                           ↓
                  SECURITY DATA LAYER
                           ↓
                METRICS & INDICATORS
                           ↓
                 KPI / KRI ENGINE
                           ↓
                  RISK CALCULATION
                           ↓
              ┌────────────┼────────────┐
              │            │            │
           SOC/SecOps   Engineering   Governance
              │            │            │
              └────────────┼────────────┘
                           ↓
                  EXECUTIVE REPORTING
                           ↓
                  SECURITY DECISIONS
                           ↓
                    REMEDIATION
                           ↓
                CONTINUOUS VALIDATION
                           │
                           └──────→ TELEMETRY
95.61 Security Metrics Checklist
Before considering the measurement system mature, verify:
Visibility
KPIs
KRIs
Risk
Governance
AI Security
Executive Decision-Making
95.62 Conclusion
Security measurement is the bridge between technical security operations and organizational decision-making.
A secure AI platform should not merely collect logs or display dashboards. It should establish a measurable feedback loop connecting:
Security Events → Metrics → KPIs/KRIs → Risk → Decisions → Remediation → Validation
The strongest measurement systems focus on meaningful risk rather than impressive numbers.
For AI platforms, this becomes especially important because traditional infrastructure metrics are insufficient. Security teams must also measure:
model behavior,
AI policy enforcement,
prompt-injection resistance,
jailbreak resistance,
tool authorization,
agent behavior,
model-version regressions,
data-access patterns,
and AI-specific abuse.
The final objective is not a perfect security score.
The objective is better security decisions based on trustworthy evidence.
A mature security program therefore continuously asks:
What changed?
Why did it change?
Does the change increase risk?
Which controls are responsible?
What action should be taken?
Did that action actually reduce risk?
When those questions can be answered consistently, security measurement becomes an active component of the platform's security architecture rather than a passive reporting function.
End of Chapter 95



Comments
Post a Comment